Why I built it
I'm a Sounders fan, and this year has not been fun. Somewhere in the middle of the record slump I stopped yelling at the TV and started asking a narrower question: what are we actually getting from our designated players?
If you don't follow MLS: Designated Players are the league's way around its own salary cap. A club can carry up to three, and only a capped part of each one's salary counts against the budget. They're how teams afford the big names, so they should be where a lot of the attacking quality comes from.
I wanted one place that answered that question for every club and every season. So I built one, fuelled by spite, grief, and curiosity, roughly in that order.
The data
First, a list of every DP. I scraped Spotrac's record of designated player contracts, fixed a surprising number of misspelled names, and ended up with all 373 DP contracts in league history, each with its club and years.
The stats come from American Soccer Analysis, whose public data covers xG and xA back to 2013. The app reads it live, so the numbers keep up with the season without me rebuilding anything.
Designing the score
Goals alone are a bad ruler. A striker on a good team scores more, and a creative midfielder can carry a side without showing up on the scoresheet. I wanted one number that would hold up across positions and playing time, so I built a composite and called it DPI, the Designated Player Index.
Every rate is per 96 minutes, which is how long a match really runs once you add stoppage time. That lets a starter and a late sub be compared fairly.
Then six parts, weighted by how much I trust them:
- Chance creation, 35%. xG plus xA. It's the steadiest signal and the best predictor of what comes next, so it carries the most weight.
- Output, 25%. Goals plus primary assists. What actually happened.
- Involvement, 10%. Shots plus key passes. A DP who disappears for 70 minutes has a problem, however efficient the other 20 were.
- Team impact, 10%. Expected points added.
- Finishing, 12%, and playmaking edge, 8%. Goals over xG, and assists over xA. Both are noisy, and the second depends partly on teammates, so they stay light.
The most important choice was the ruler. Each part becomes a percentile against the regular starters at the same position, DPs and non-DPs alike. A winger shouldn't be graded against strikers, and grading DPs only against each other hides the real question, which is whether the expensive player beats a normal one.
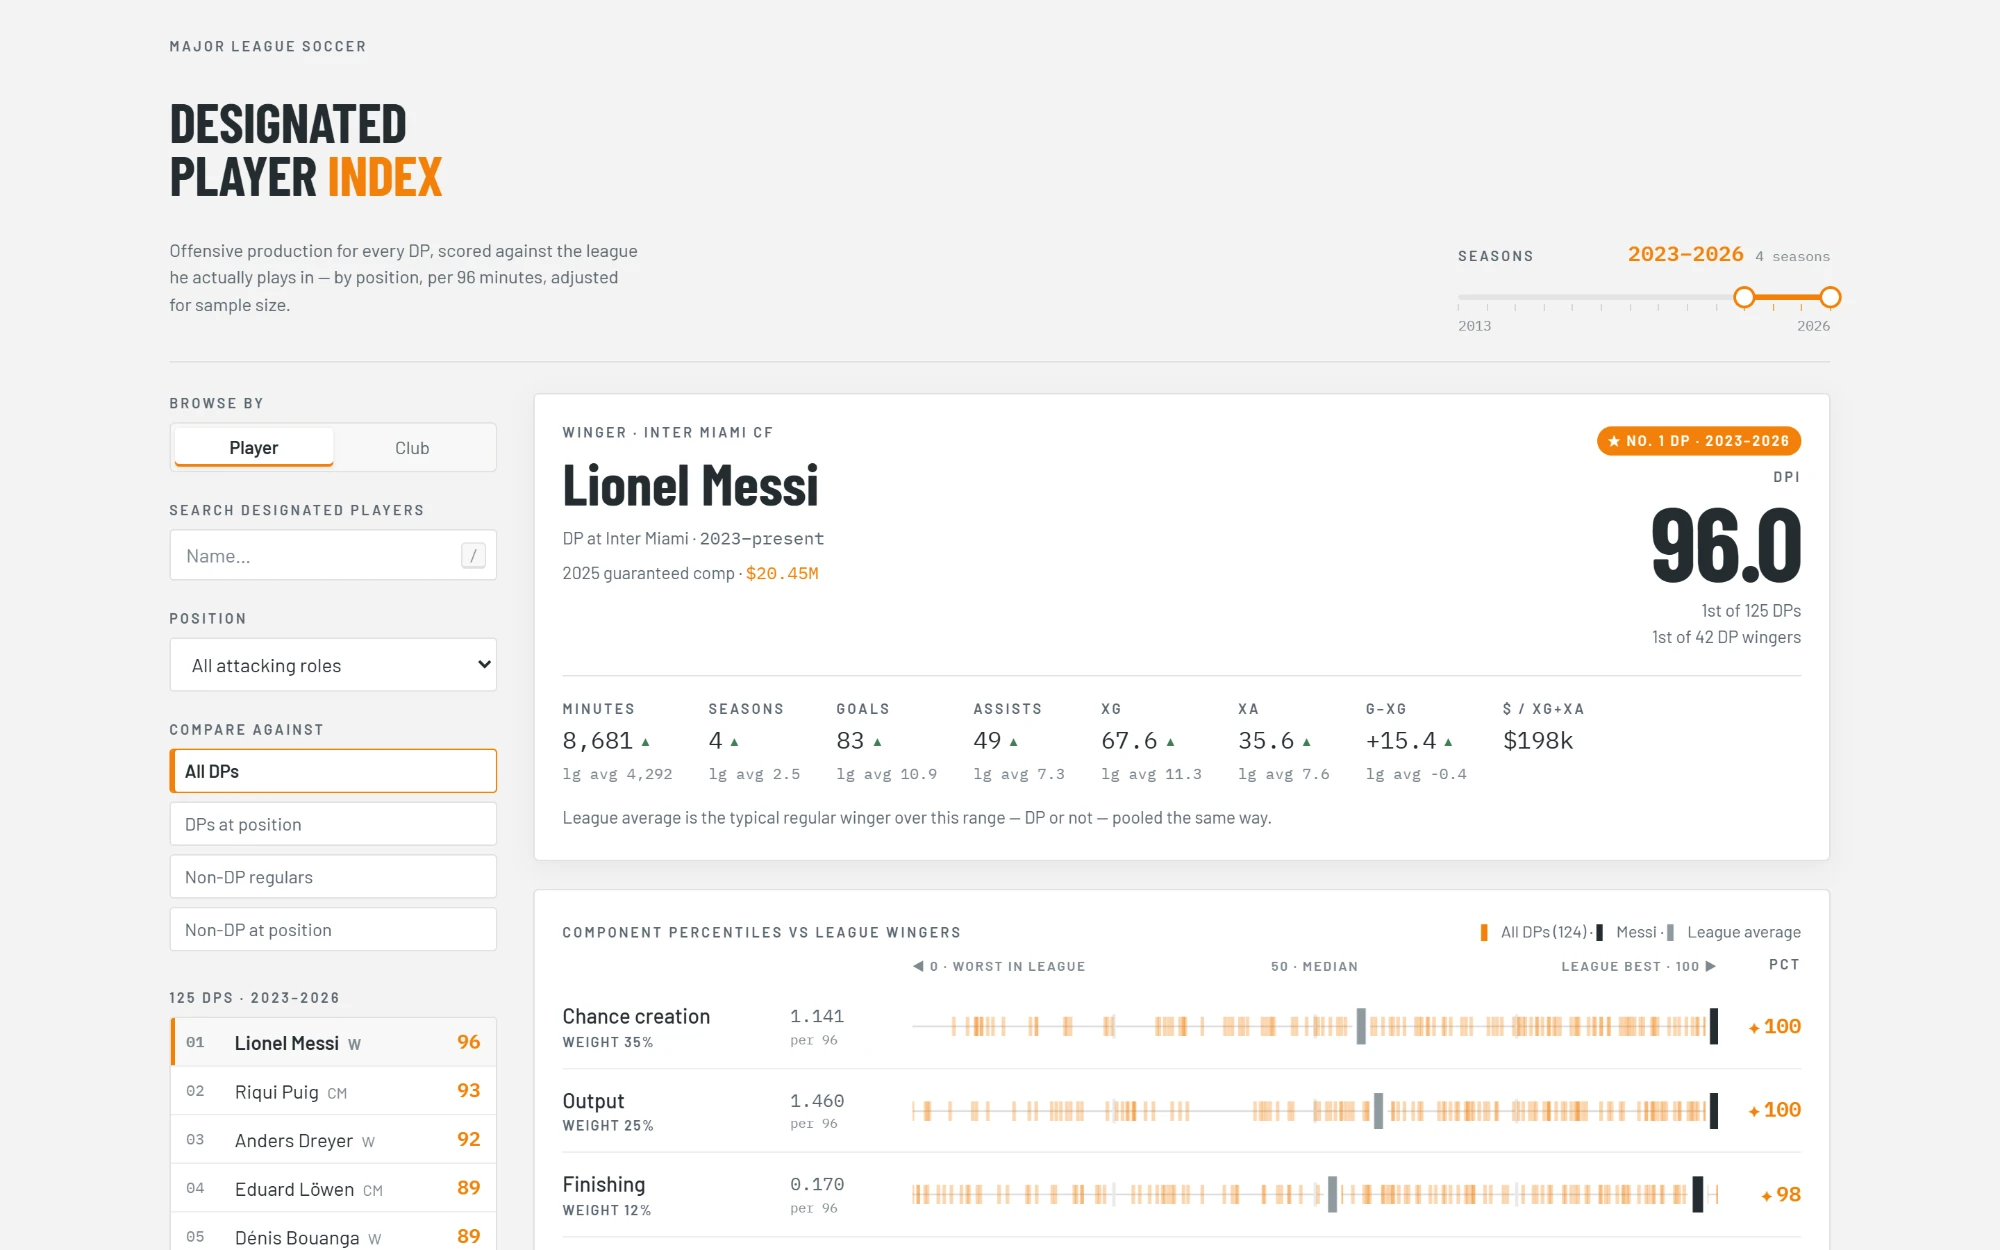
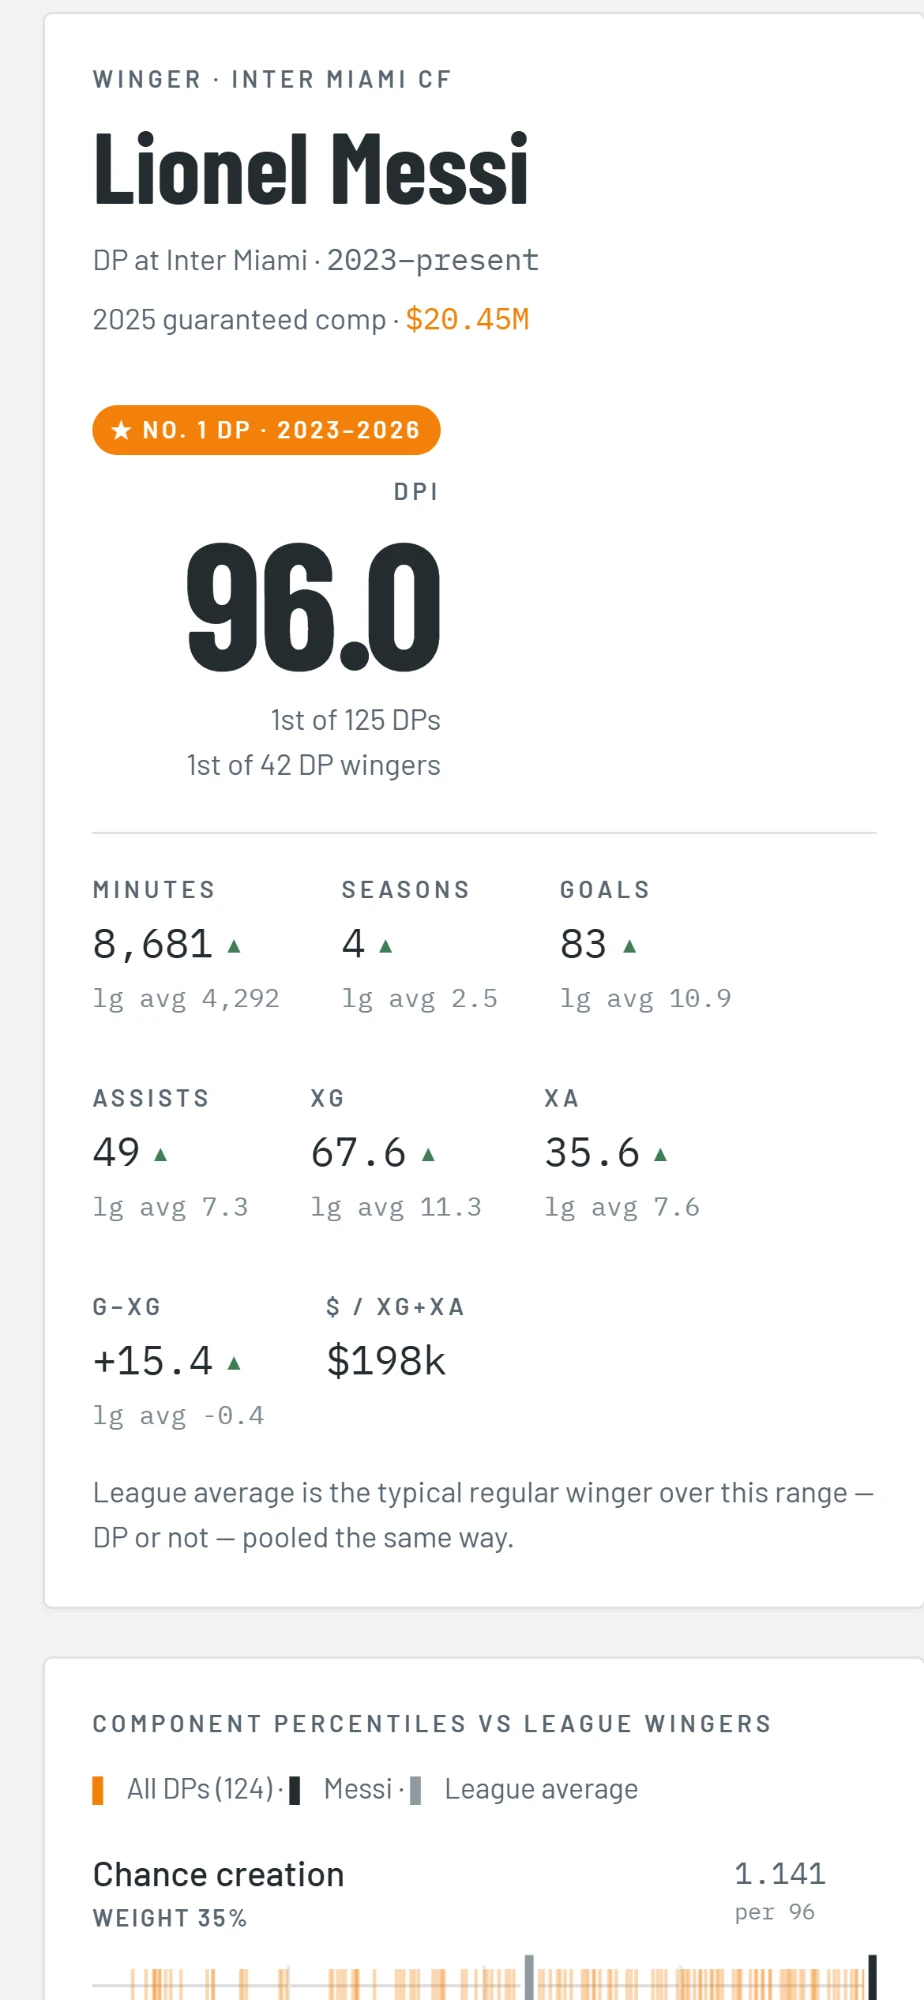
Small samples get pulled toward the middle, more strongly the fewer minutes a player has, so two great games don't put someone at the top of the table. The result is a score from 0 to 100 where 50 means a typical starter. Over 2023 to 2026 Messi scores 96, which was a useful sanity check.
Why the long rails
A single score is where an argument starts, not where it ends. So every player gets all six parts laid out on long horizontal rails running from worst in the league to best.
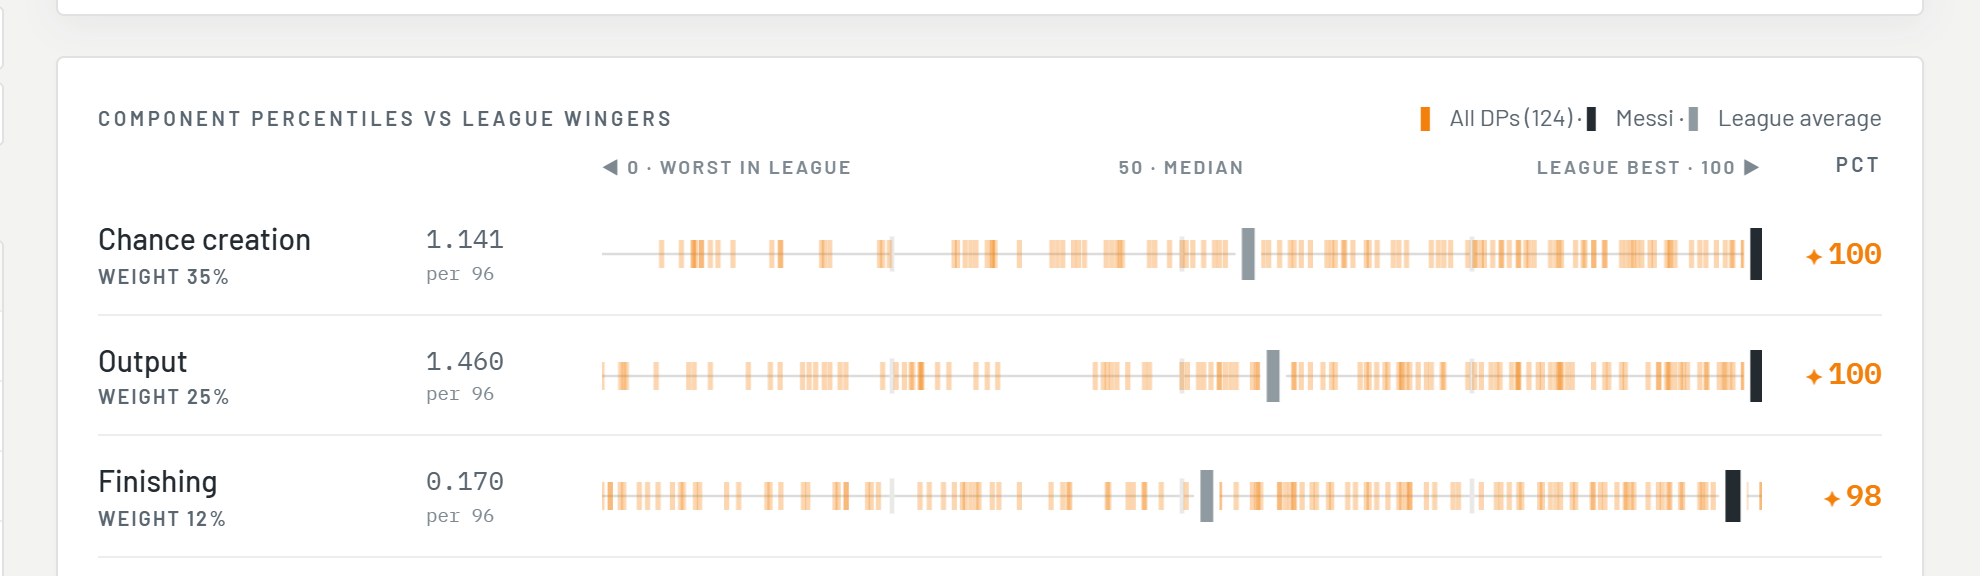
Each orange tick is another player in the comparison group, the dark bar is the player you picked, and the grey bar is the league average. I made them long and horizontal so you see the whole crowd, with its clusters and gaps, instead of a lone number. You can tell at a glance whether someone is elite at one thing and ordinary at the rest. When ticks pile up on the same spot, hovering shows everyone there.
The grey bar is usually not at 50. Averages get dragged around by outliers in a way percentiles don't, and seeing that gap turned out to be useful.
The comparison group is a switch: all DPs, DPs at the same position, non-DP regulars, or non-DPs at the same position. Each one answers a different question, and the last one is the most humbling.
Time as a control
DPs come and go, and a single season is noisy, so the time window had to be easy to change. It sits at the top as a two-thumb slider that snaps to whole seasons, and everything on the page rescores when it moves.
Picking a player snaps the range to the years that player was actually a DP. A window that changes on its own reads like a bug, so a short message says what happened and offers Undo.
When the range changes, the leaderboard briefly marks who climbed and who slid, and rows glide to their new positions instead of jumping, so you can follow what moved. Each player also gets a season-by-season chart. Seasons with no data break the line rather than being bridged, because a smooth line through a missing year would be lying.
Clubs needed their own view
Clubs looked like the same problem at first. They aren't quite, because a club goes through a lot of DPs over the years, and the interesting part is how they group.
So the club page puts all of its DPs on one rail among every DP in the range. You can see straight away whether a club has one star and several misses, or a tidy cluster of decent signings. Below that, a chart shows the club's average DP score by season against the league average, with each season scored on its own. You can add other clubs to the chart, which is a reliable way to make yourself feel worse.
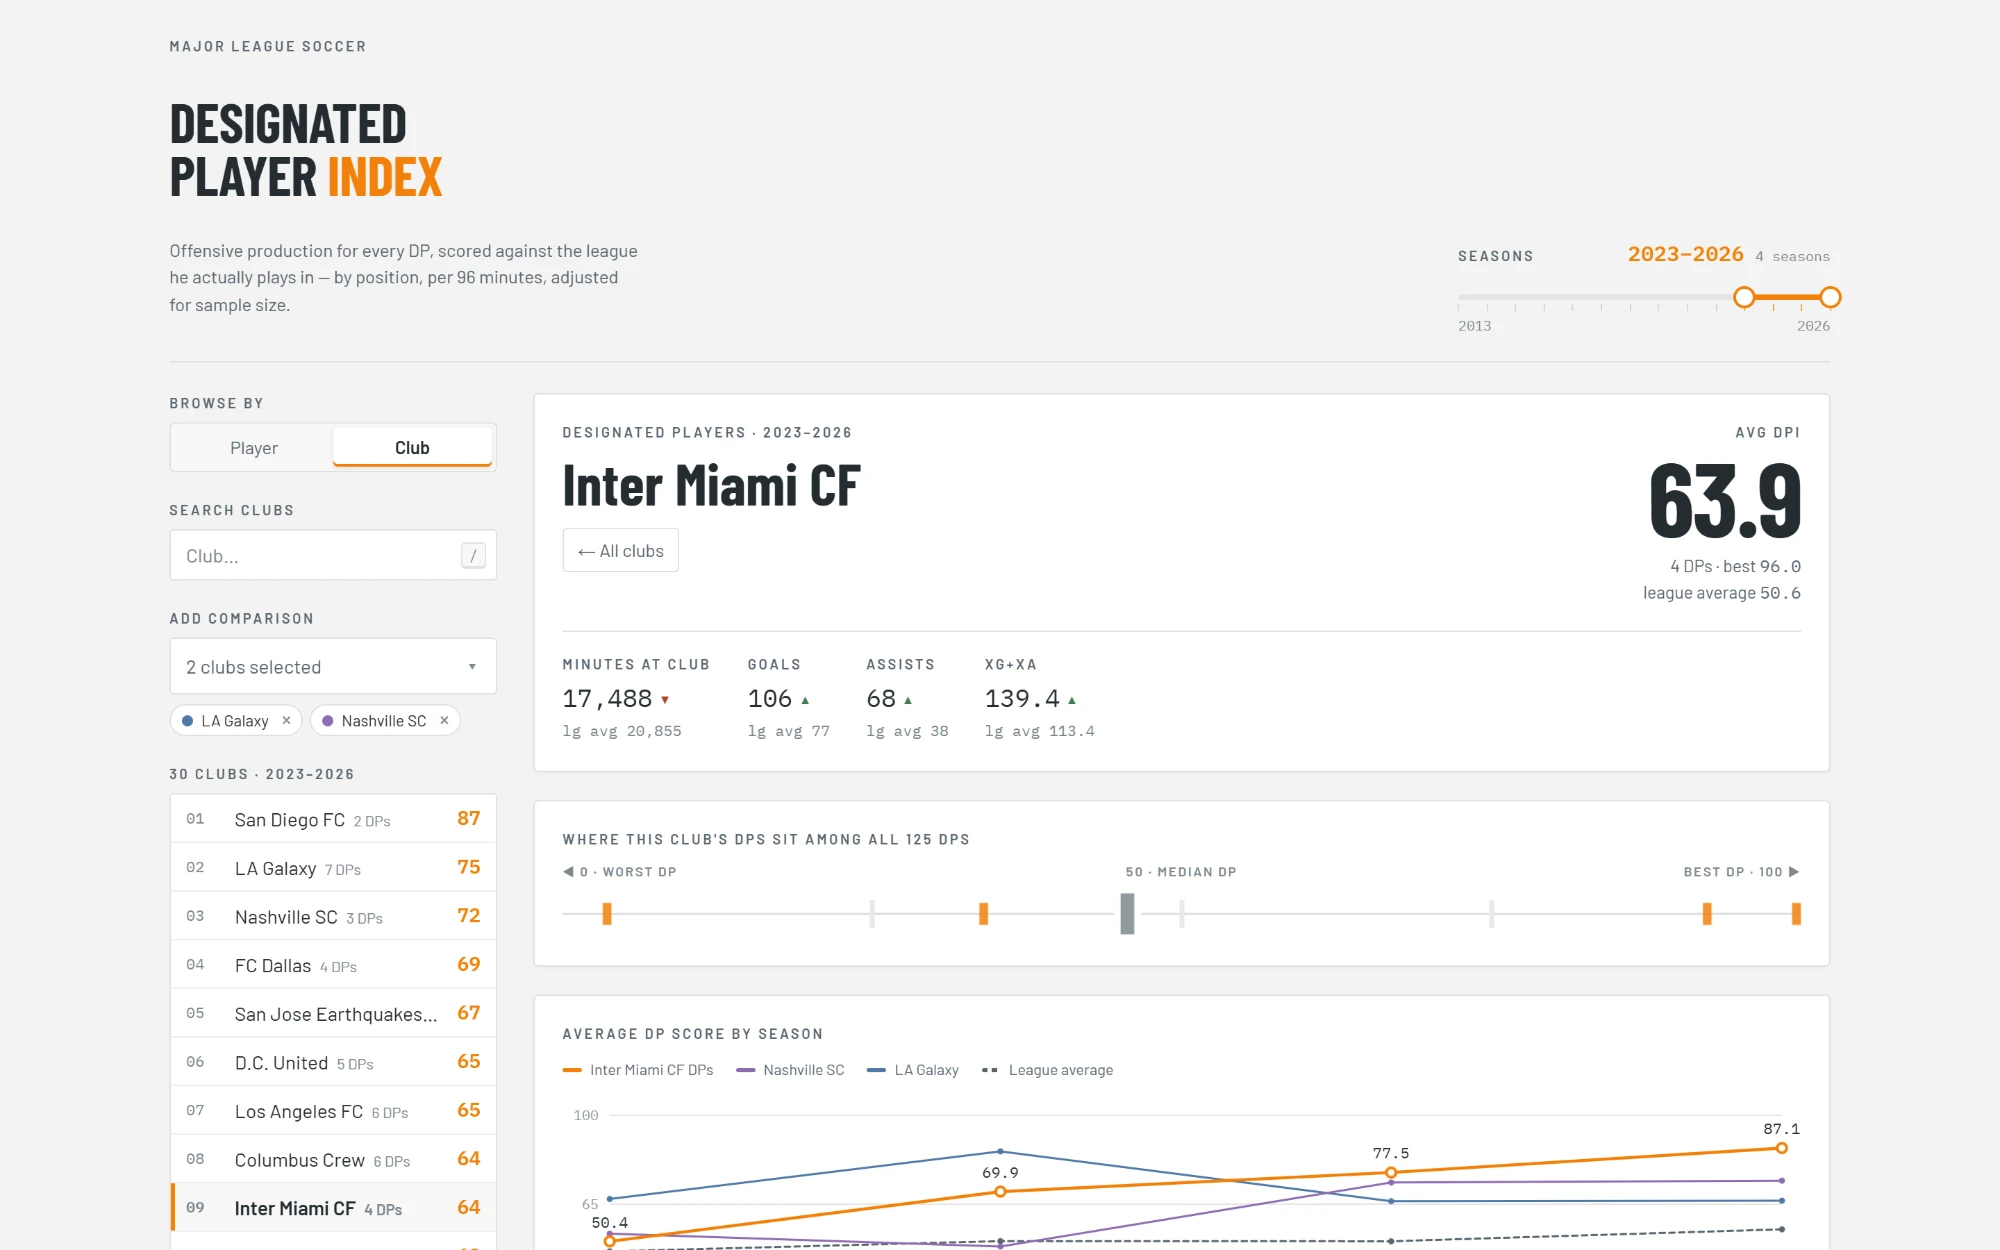
A table at the bottom ranks every DP the club has had, overall and at their position. One rule needed spelling out on the page: a player's DPI pools every season in range, including time at other clubs, while the minutes and goals shown are that club's only.
The small stuff
- Press / to search, use the arrow keys or j and k to move through the list, and Esc to back out.
- Numbers count up to their new values instead of snapping, and the motion switches off for anyone who prefers reduced motion.
- Seasons load in parallel, a few at a time, so the first screen doesn't wait on fourteen requests in a row.
- A methodology section at the bottom explains the whole index, for anyone who wants to argue with my weights.
- It works on a phone, since that's where most soccer arguments happen.
It started as a way to be annoyed at my team with better evidence, and turned into a pretty good design problem. The Sounders' numbers are in there if you want them. I'm not repeating them here.
Open the DP Index ↗